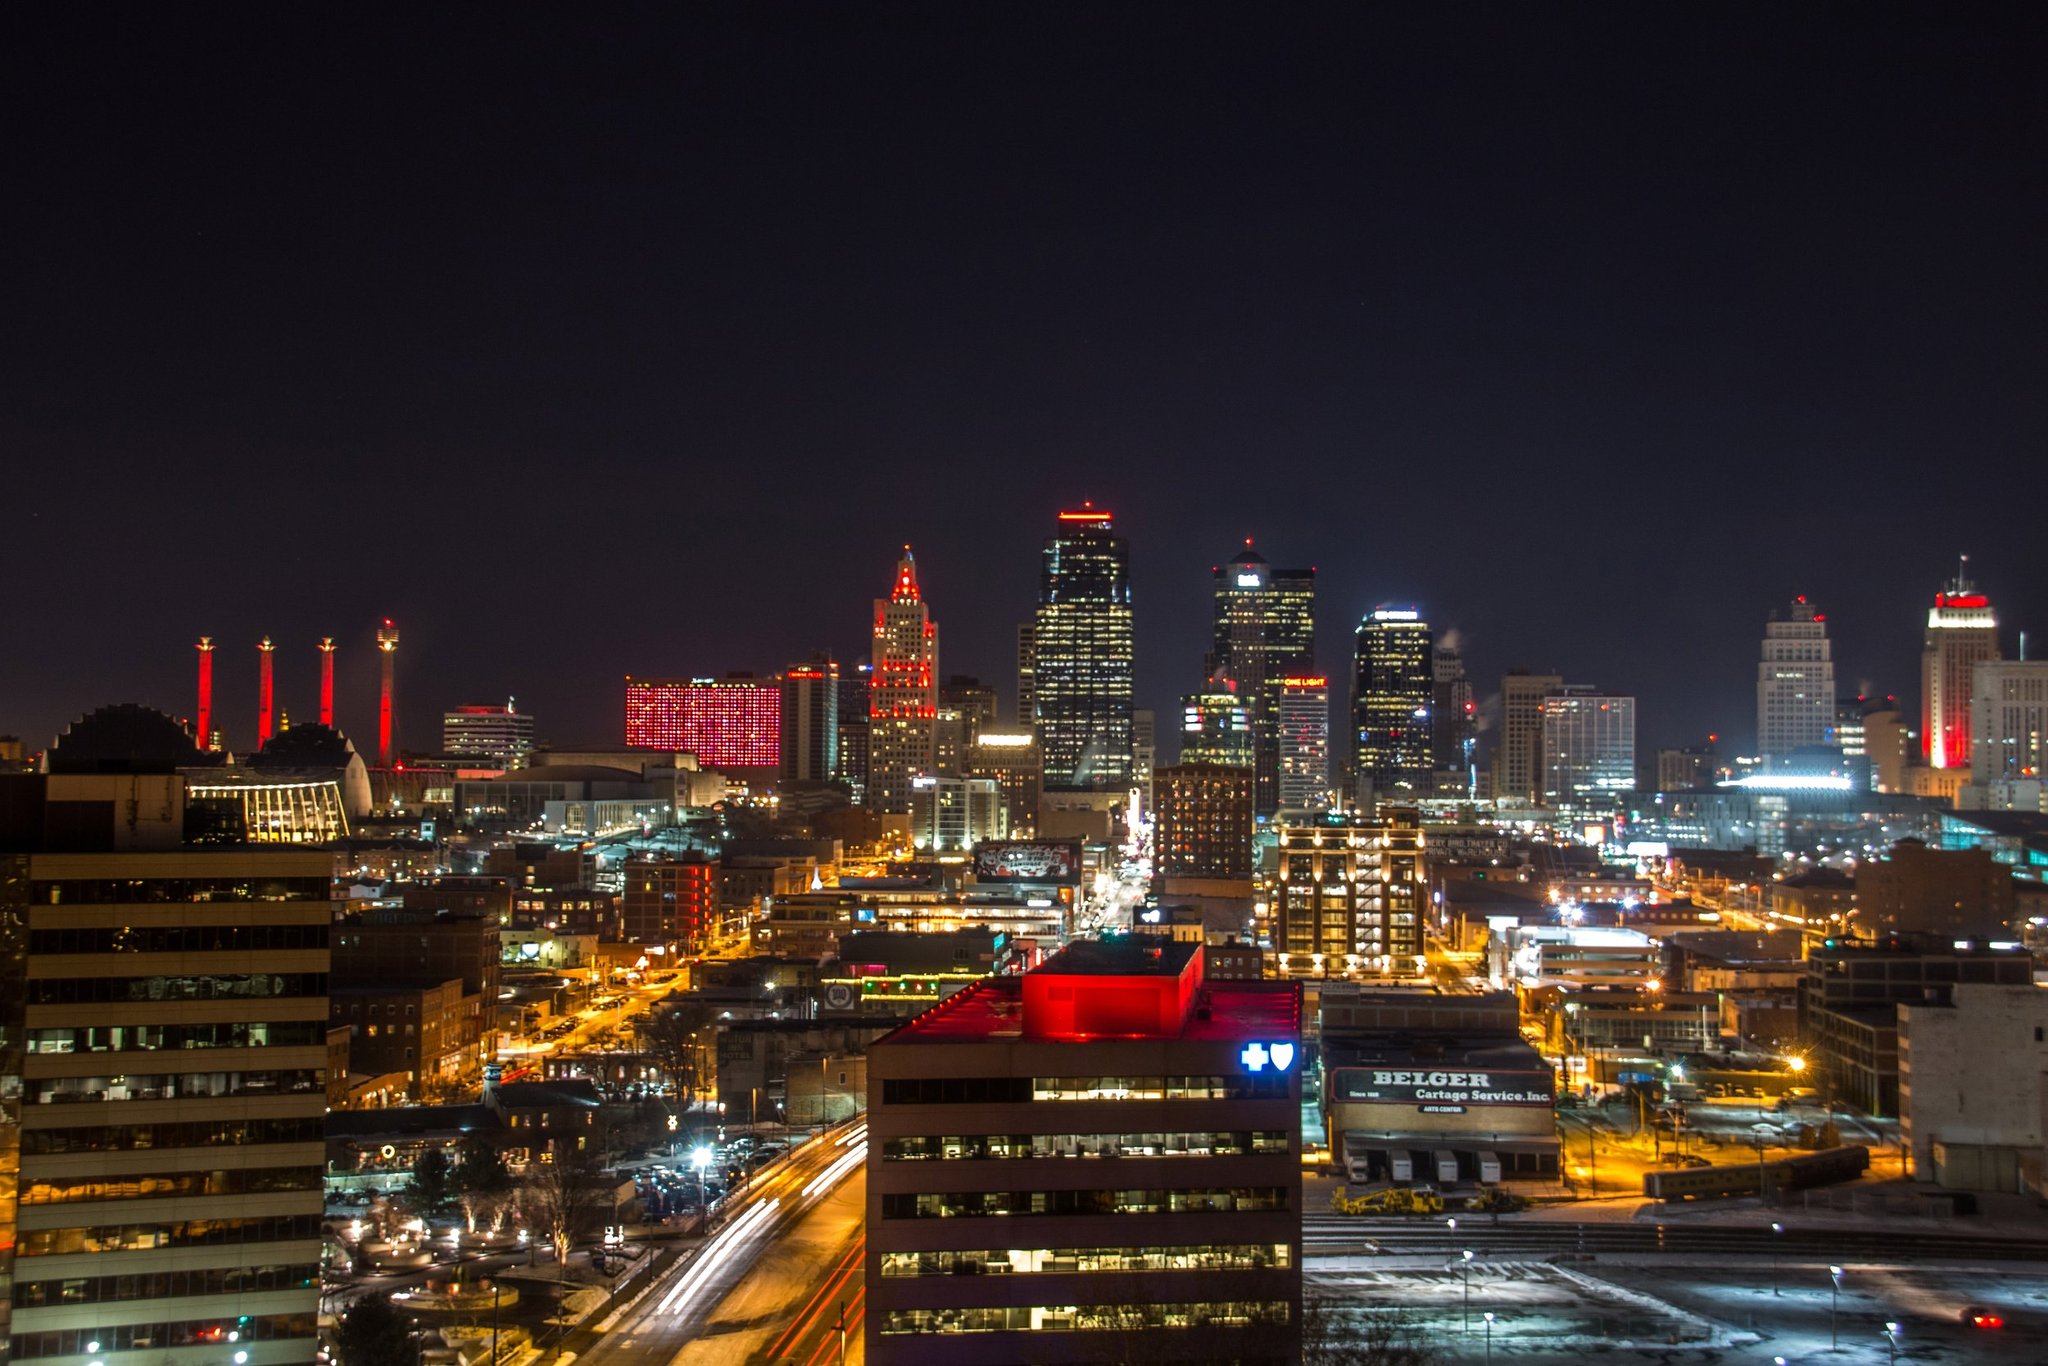
Numbers by day. Light by night.
I'm Andrei Pinter, an analyst in Kansas City with fifteen years in supply chain and inventory data. After hours I build fast, free tools for the questions I keep running into, and I photograph the places I go.
Kansas City, Missouri January 6, 2017
Work
Six live sites. All free, and all built in public on GitHub.
-
PulseNewsMarkets and news, terminal-style
A markets and news terminal that runs itself on free data. Indices, yields, currencies, commodities, crypto, freight and pharmacy share one dense, keyboard-driven screen, with 49 news sources merged and ranked by impact. It refreshes every 15 minutes while markets are open, and an open page updates without reloading.
- 90 instruments
- 49 news sources
- 15 min refresh
-
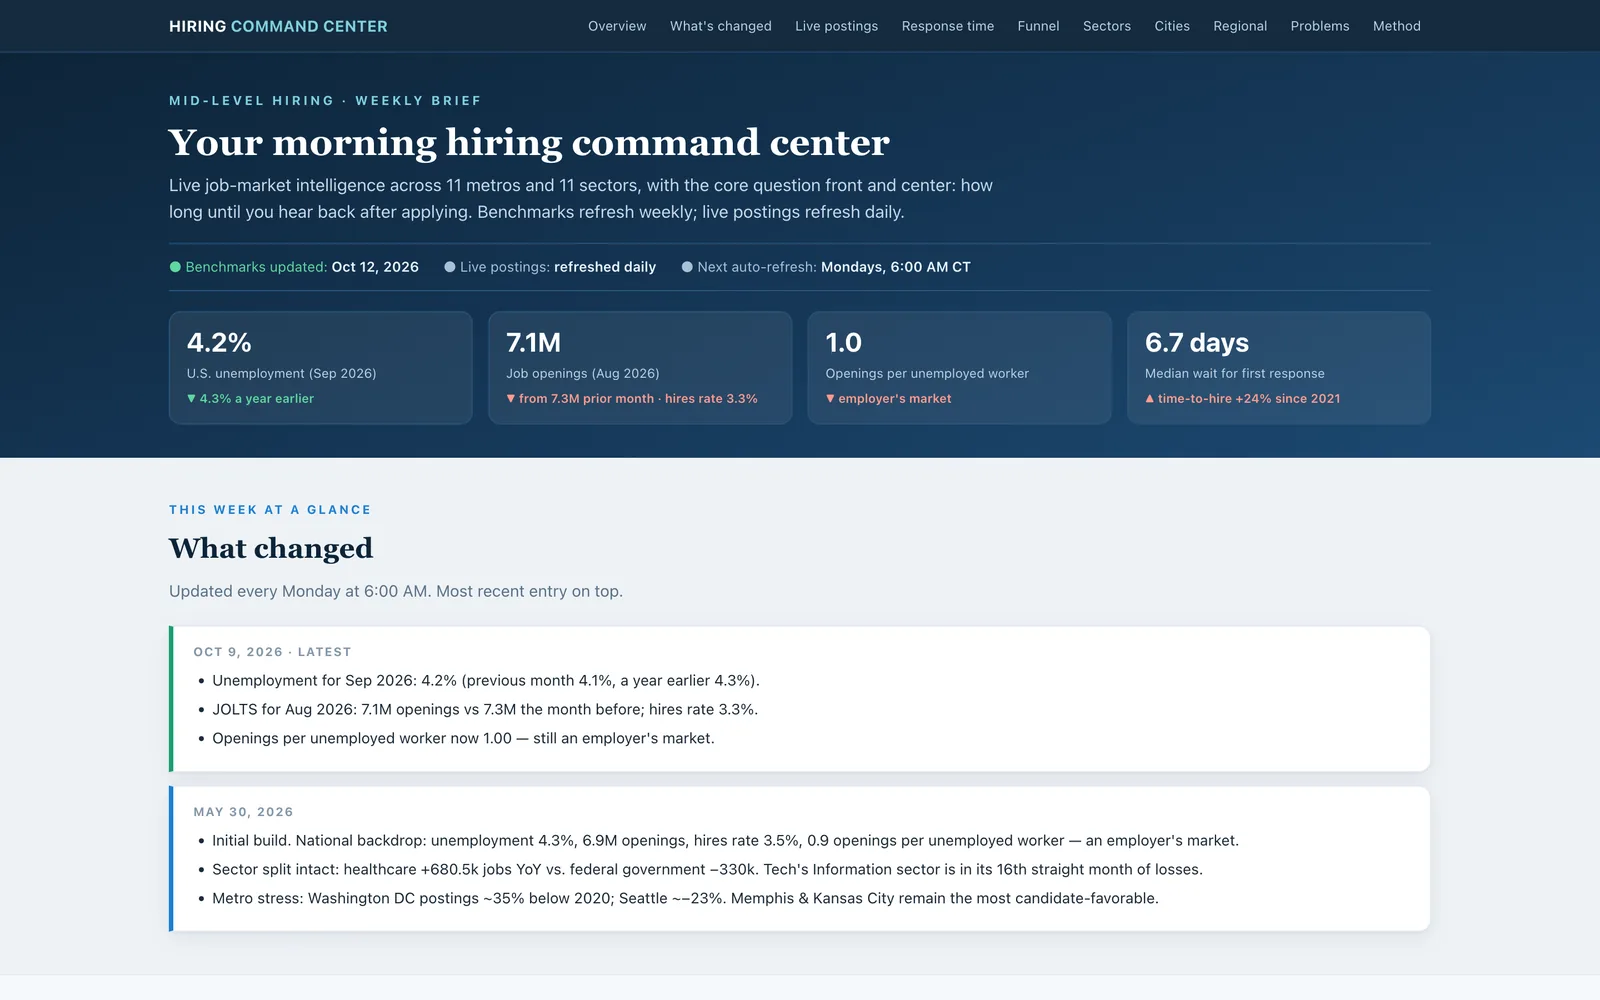
Hiring Command CenterThe job market, briefed every morning
A morning brief on the market for mid-level roles. Live postings refresh daily, BLS unemployment, openings and hires land every week, and the question job seekers actually ask sits up front: how long until you hear back?
- 11 metros
- 11 sectors
- Daily postings
-
Supply chain toolsPlanning, capacity and scheduling models
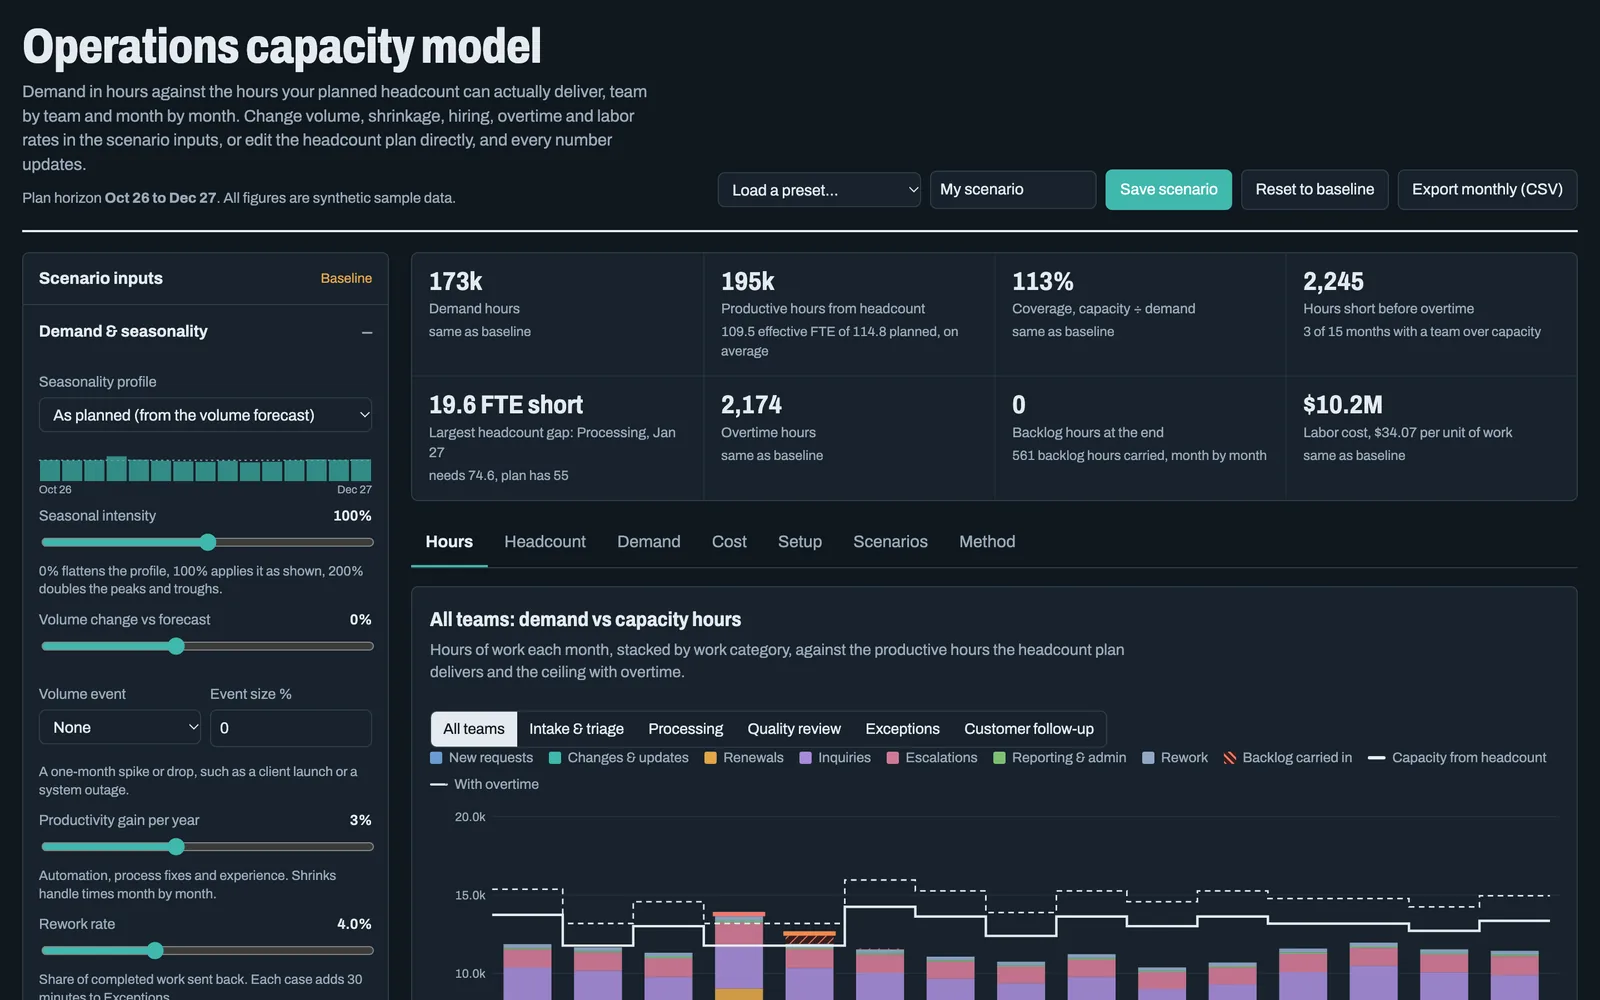
Three working planning models on sample data. Drag the plan line in the supply and demand planner and watch stock and exceptions respond, set demand hours against what a planned headcount can deliver in the capacity model, and read a production schedule. They roll forward on their own every month.
- 3 models
- 15-month horizon
- Monthly roll-forward
Supply and demand plannerCapacity modelProduction schedulerSource on GitHub
-
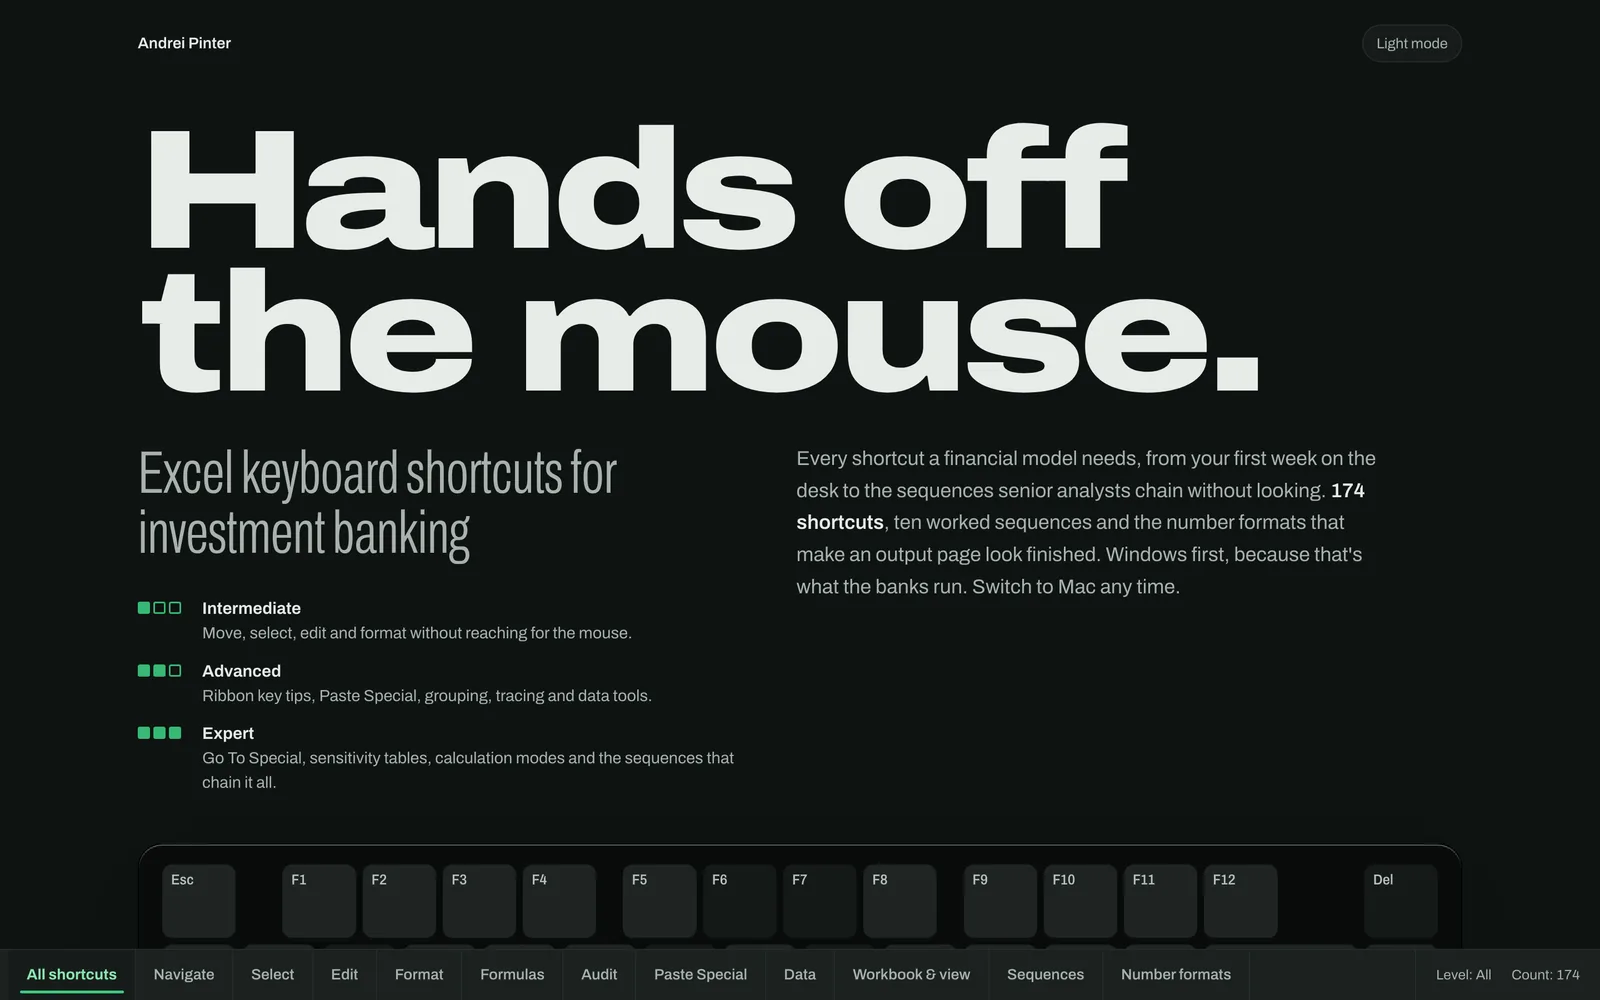
Hands Off the MouseExcel shortcuts for investment banking
174 shortcuts, from your first week on the desk to the chains senior analysts run without looking. A keyboard heat map shows which keys earn their keep, an inspector lights up every keystroke, and ten worked sequences turn it all into muscle memory. Windows first, Mac any time.
- 174 shortcuts
- 10 sequences
- 3 levels
-
The Physics of the PictureA field guide to TV display technology
A course-length guide to how a television makes light and bends it into color: LCD and Mini-LED, OLED and QD-OLED, RGB-LED backlights, MicroLED and the quantum-dot future, from first principles to what each one costs.
- 8 technologies
- 6,014 nits, brightest measured
- 580× price spread
-
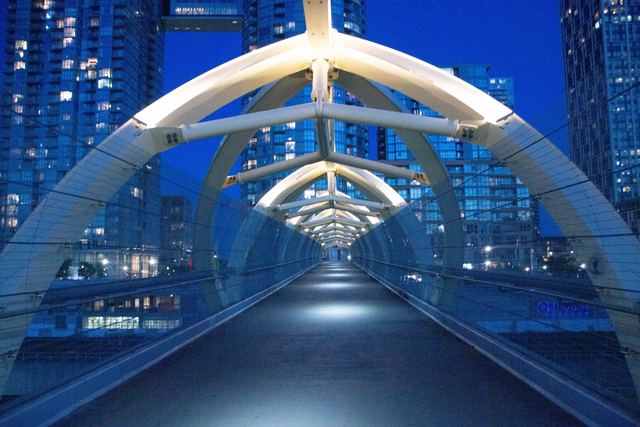
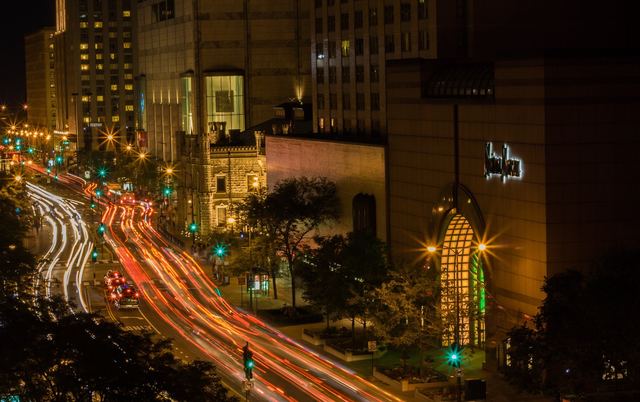
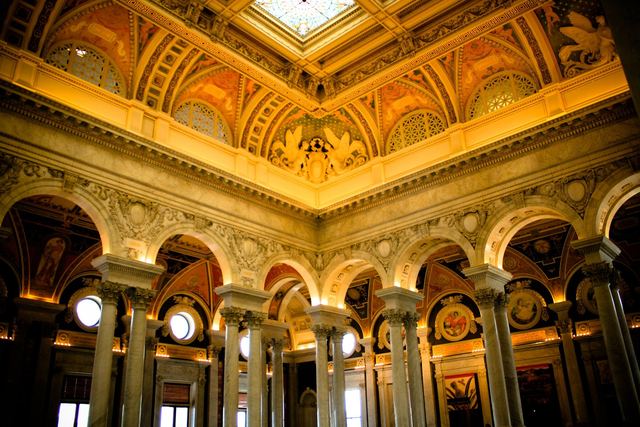
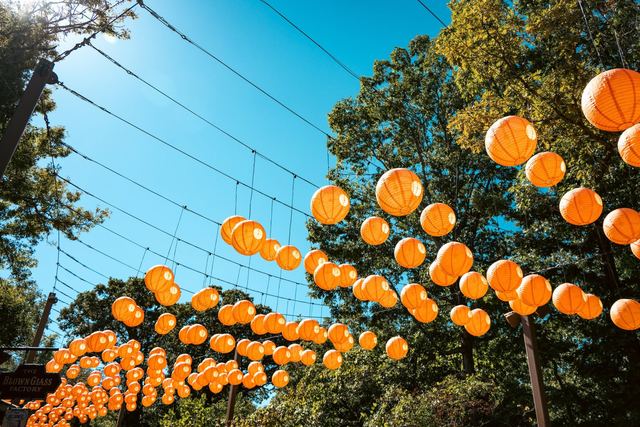
Photography295 photographs, arranged by place
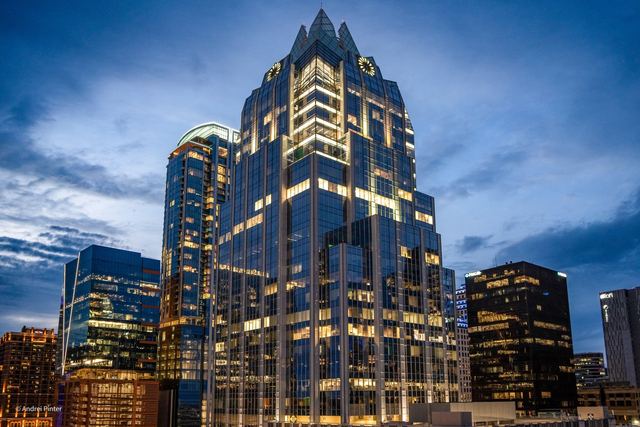
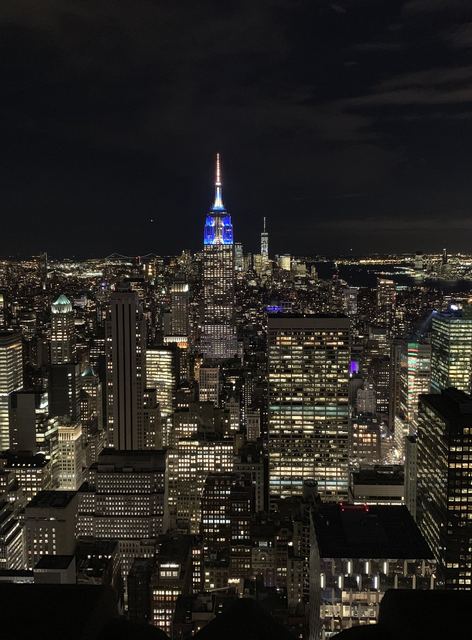
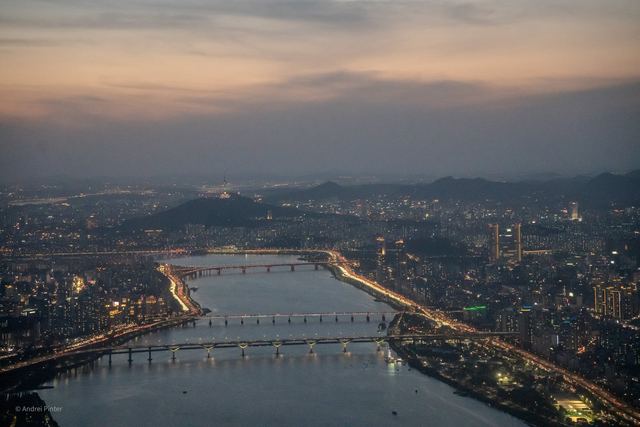
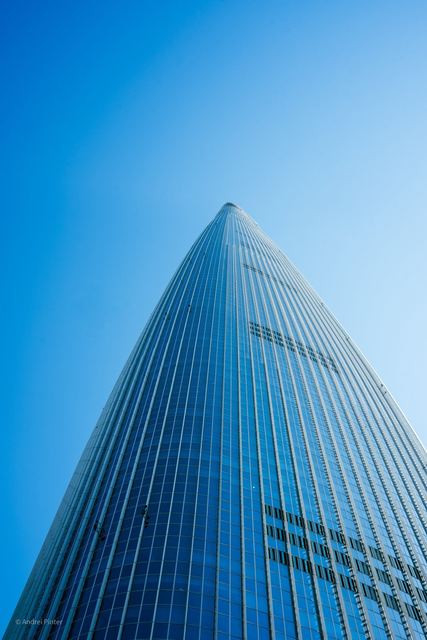
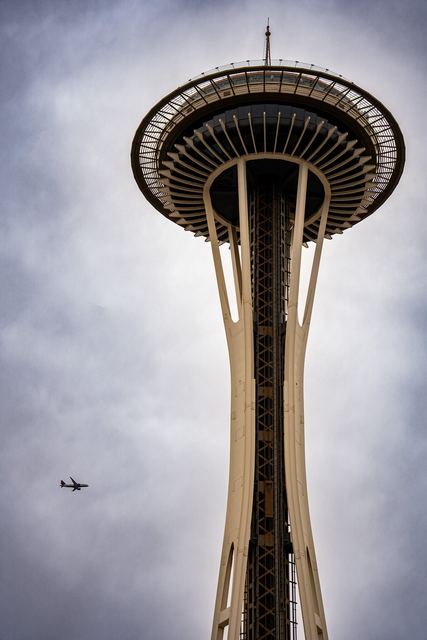
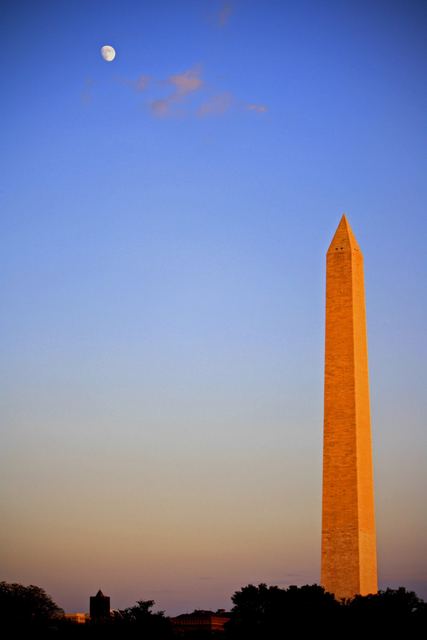
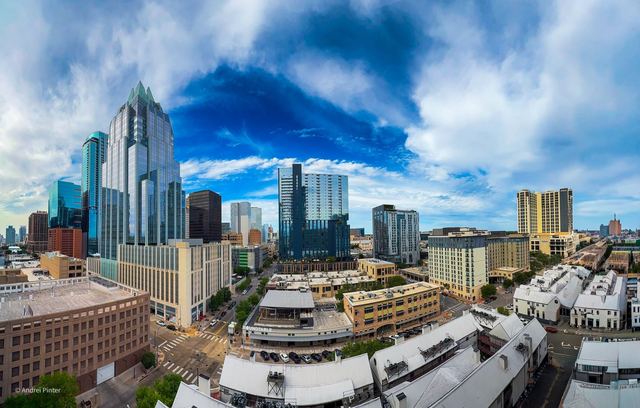
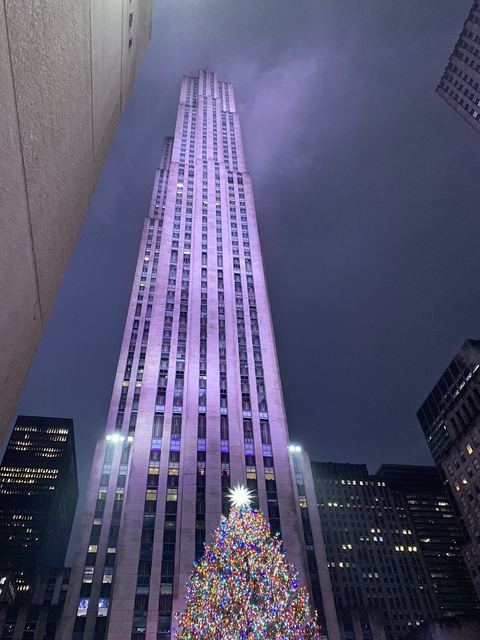
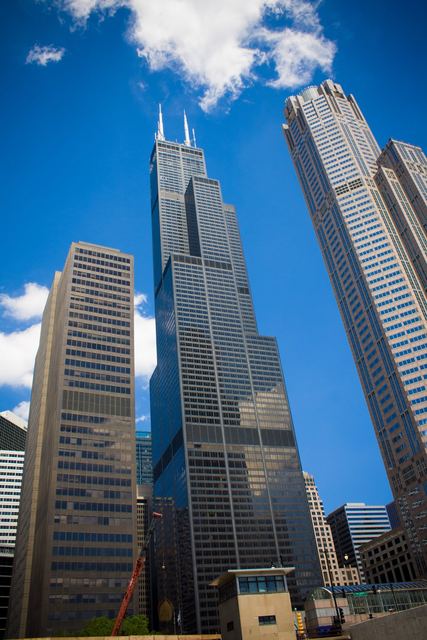
Fourteen places, from blue-hour Seoul to the Kansas City skyline, shown big on black with nothing in the way. Point at a place and the whole screen becomes it.
- 295 photographs
- 14 places
- 2010–2026



Photographs
295 frames from 14 places. Each one below opens in the portfolio.


About
I started on a warehouse floor, receiving parts and counting inventory, and worked up through inventory leadership and supply chain planning into analytics. That's why everything here starts with a real question and ends with something you can use.